|
In this issue: key stocks are providing outperformance, gold demand remains robust, and we talk about the mixed results in the gold sector. Read this latest Dawes Points to better understand the global forces that drive resources sector investment. Key Points - US gold price up 10.3% in 2017 to US$1268/oz - A$ Gold price back above A$1700. - Asian gold demand remaining robust - Australian Gold production forecast up 16% to 345t for FY20 - MPS Gold Producers Universe 17 stocks FY18 PER 7.1x, FY19 6.6x - Universe gold production to rise 15% to 5.2moz (excluding Newcrest) by FY19 - Excellent opportunities in Australian Gold Stocks - North American stocks picking up, royalty companies leading Preferred stocks: - Northern Star Resources Ltd ( Gold stocks have had a bumpy and volatile ride over the past six months with the better stocks strong and technically very constructive whilst much of the emerging sector has been weak and friendless. Many of the fallen are now outstanding value opportunities. The strength of the global equity markets is reinforcing a better outlook for commodities and gold will continue to benefit from rising wealth in Asia and Africa. The Australian Gold Sector has been a leading indicator of the expanding global economic boom. The A$ gold price has provided a strong incentive for the Australian entrepreneurial mining sector to do what it does best, and gold production in Australia has again exceeded 300 tonnes and is on its way to grow at least another 15% to 345t by 2020. The majors and mid caps are reporting production growth and a slew of merging companies are carrying out a repeat of the 1983-1990 gold production explosion when Australia went from 30tpa to 244tpa on the way to 314t by 1997. This graphic has just been updated to include newly-indentified gold mining projects and you can rest assured that many more will emerge over the next year. The growth in gold production with a A$1,700 gold price will be wonderfully profitable for existing producers and will also allow numerous smaller players to bring profitable new mines on stream and often to just deliver ore to existing nearby mills so requiring only small pre mining capital expenditure. The MPS Universe of Major Gold Producers (excluding Newcrest) of 17 stocks should have gross gold production of about 4.6moz in FY17 and this should grow to 5.2moz for FY19. The 17 stocks have a market cap of about A$17bn and should report earnings of around A$2,000m in FY18 and FY19 at A$1,700/oz. The PER is 7.1x for FY18 and 6.6x FY19. MPS has a second universe of more than 40 emerging companies and from this data it is clear that Australian gold production will be up by almost another 1moz (34t). Do note this history from one of my reports in Jan 1989 where I forecast almost 200 tonnes for 1990. The actual outcome was 244 tonnes and it just kept growing. Earlier reports in 1986 and 1987 were only forecasting up to 150 tonnes. Australian Gold Production peaked in 1997 at 314t.
Source: Bain Matrix of Australian Gold Producers Jan 1989. And to reflect this, the ASX Gold Index of the time (established in about 1986 and backdated) rose from 400 in mid 1985 to its peak at 4413 in 1987. 1,000% in just 18 months!
The performance of the ( This boom will be more about the growth in Australian gold production and the +226% first leg up from late 2014 was just the beginning.
The performance of the gold sector in 2017 has been volatile and the ( It is clear that the larger producers and the dividend payers have outperformed in the ( SBM, NST, EVN and WGX are the senior players and did well with CDV and NST’s EKJV partners TBR and RND also performing. CDV has been outstanding and seems destined for even better things. NCM is OK but is acting like the big North American gold companies. In the smaller players, KIN with some outstanding drill results performed strongly and SWJ has been a MPS favourite as has PNR. WGP is starting to hit its straps and CYL is an emerging star. Many more new gold players are emerging and will be added to the MPS lists.
Amongst the awful performers in 2017 there has certainly been some value created in SLR, BLK, PRU and DRM amongst the bigger stocks and AHK, HAV and TNR seem extremely cheap. Gold stocks are still improving their market share with some weeks in April 2017 exceeding 5% again. Dawes Points considers that this can only rise further.
In terms of technical performance the (
But some individual stocks are looking very strong and seem ready for a robust breakout very soon. (
(
As does (
(
As does (
And late bloomer (
(
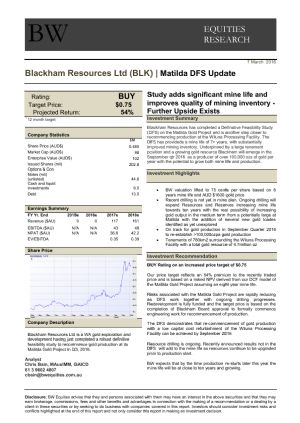
Gold production for BLK in FY18 should be 90-100koz and the expansion to >200kozpa should be done without resort to additional equity. At 80kozpa with cash costs ~A$1200 and a A$1700 gold price this is A$40m cashflow and at 200kozpa this is A$100m cashflow. Market cap is only A$106m. At A$0.31 this is very cheap.
Gold Price OutlookIt is always helpful to look at the long term for US$ gold and to keep in mind that all the reasons for holding gold are still with us:-
The power of the twelve year first leg up from US$246 up to US$1923 was truly impressive. The pullback and consolidation over the next six years is also impressive in that gold has held up so well. The time intervals between the various moves have been trying the patience of the bulls but we are slowly but surely getting there. Don’t despair. The power of this bull market in gold does look majestic in the time frame here.
This Elliot Wave interpretation is also of great significance showing the strength into Sept 2011 and the subsequent shallow retracement.
US$ Gold is pushing up against the downtrend line for a third test. A break here could be just as powerful as the earlier moves in gold.
The flow of gold into China and India is absorbing all mine production and the flow is one way. Nothing is coming back. This is the main driver. The gold held by the Bank of England has declined.
And the flow is one way only.
At the same time this flow of gold is taking place it seems that the US$ is softening as shown by the US$ Index and reinforced by the above-noted weakness against the major currencies Euro, Yen, Swiss Franc, Rupee and Sterling
North American Gold StocksThe lack of leadership and market interest in the Australian Gold Sector at present forces attention on the North American markets. The best indicators have been the ETFs for the larger stocks (GDX) and the next level of stocks in the GDXJ. However, it is notable that amongst the best performing stocks have been the gold royalty companies Royal Gold ( (I am looking at building a gold royalty company here so if anyone is interested you might like to give me a call.)
Both of these look very constructive.
The royalty companies are leading:- Franco-Nevada (
And Royal Gold (
Top North American-listed performers include:- Agnico Eagle Mines (
And Kinross Gold Corp (
Randgold (
The really big US companies Barrick and Newmont have tended to perform with the various indices but both seem capable of strong moves soon. Barrick Gold Corp (
Newmont Mining Corp (
The US$ Gold Price action seems constructive and its strength is matched by gold in many other currencies so that the world will be looking at a bull market for gold in all currencies. The gold stocks are also proving some good leading indicators with key stocks providing outperformance while the general market and the smaller stocks have been soft and engendering a mood of pessimism. These market sentiment characteristics generally provide a sound base for an upward move in any market. Contact me to participate. Dawes Points #65 |


About Martin Place Securities
 Martin Place Securities is Australia's Boutique Resources Investment Firm, specialising in emerging mining, resources and energy companies.
MPS was founded in October 2000 to provide a link between Australian resource sector opportunities and investors from major financial centres in Europe, North America and China. We are well known for identifying and financing early stage prospects that develop into successful growth companies.
MPS provides services in Corporate Advisory, Stockbroking, Investment Research and Education.
![]()
![]()
![]()
| ||
|
Wiluna Mining Corporation Ltd
Tribune Resources Nl
Torian Resources Limited
Stonewall Resources Limited
St Barbara Limited
Royal Gold Inc.
Randgold Resources Ltd
Perseus Mining Limited
Pantoro Ltd
Oceanagold Corporation
Northern Star Resources Ltd
Newmont Mining Corp
Newcrest Mining Limited
Martin Place Securities
Kinross Gold Corporation
Gold Road Resources Limited
Franco-Nevada Corporation
Evolution Mining Limited
Eastern Goldfields Ltd
Catalyst Metals Ltd
Cardinal Resources Ltd
Barrick Gold Corporation
Ark Mines Limited