Gold Stocks Up >35% in Continuing Recovery - Much More to Come
Sydney, Jan 7, 2015 AEST (ABN Newswire) - The technical evidence is mounting for a significant change in market sentiment for gold and the gold sector in North America and here. The evidence may still be tentative but important changes seem to be underway in a number of markets. The long overdue new bull market in gold and gold stocks looks promising for 2015. After 2014's annus horribilis for resources stocks I look to enjoy 2015 as an annus mirabilis, one that is "amazing, wondrous, remarkable".
Key Points
- Australian Gold Index up 7.8% in 2014
- Australian Gold Index up 35% from November 2014 low
- Nth American gold stocks testing downtrends
- US$ Gold price still holding around the US$1200 level of a year ago
- A$ gold price closed up 7.5% for 2014
- Gold in other currencies moving higher
- Gold stock recommendations ( ASX:NST), (ASX:TBR), (ASX:NCM), (ASX:GOR), (ASX:OGC), (ASX:RRL), (ASX:EVN), (ASX:ABU), (ASX:BDR), (ASX:KCN), (ASX:MML), (ASX:SAR), (ASX:MLX), (ASX:RSG), (ASX:BLK), (ASX:CGN), (ASX:DRM)
Gold itself had a tough time in 2014 with early 2015 US$ prices barely higher than a year ago and the US Gold Index (XAU) was down 18% (after a 49% fall in 2013). The ASX Gold Index (XGD) benefitted from a lower A$, improved operational performances and some better market sentiment to actually achieve a 7.8% gain with almost all of it in the last week of December. Falling oil and other energy prices can only cut costs further and help operating margins. This is all very encouraging.
The evidence shows that US$ gold is much the same as a year ago. It was some times higher and sometimes lower but the low at US$1130 in November may prove to be the low for the correction from US$1923 in September 2011 in a 38 month bear market. This is a good overall performance for gold against the very strong US$ and with so much pessimism about.
Steady gold in a strong US$ meant that gold in other currencies in 2014 was much higher, particularly in Japanese Yen and Euros. The technical evidence here is suggesting higher gold prices are coming in these currencies. And this is the main reason people should hold gold - debasement of currency. Just ask the holders of Russian Rubles.
It would be good if the turn was here, but some bearish views still consider the bottom test should be the lows in 2001 with a much lower gold price! The gold stocks here are suggesting that the low is probably in place and should rally to new highs.
The performance of gold stocks against gold has also been a disaster of epic proportions. The key North American index XAU has fallen over 85% against US$ gold, since a peak in 1996, and is now still less than 25% of its long term average rating. Encouragingly, the XAU has just made a tentative break of a short term downtrend against gold. A rerating here would be very significant and particularly so if gold does move higher in US$.
Another measure of gold stock valuations has been that against the general market. After a magnificent ten year run of 16%pa against the S&P500 from 2000 to 2011 these gold stocks fell 85% to give up almost all of that gain over the ensuing next three years. Extreme relative value now exists. Also a short term downtrend is being tested and broken here too.
These are indeed tantalising and stock standard technical market-bottoming developments. The implication is that gold stocks could strongly outperform both gold and the S&P500 for an extended period if the trends get momentum and strength. Let's keep watching carefully.
The US$ and T Bonds
Gold and the US$ often act divergently and T Bonds are really US$ with a coupon so should act as US$. But gold has risen with a strong US$ over the past decade on a net basis.
The strength of the US$ has been amazing, as has the performance of the US 30 Year T-bonds with yields down to just 2.5%. Looking at the long term and the most recent market action suggests that a spike high may be developing.
These markets have been far stronger than ever imagined so clearly no superior knowledge lies here with me!! But. But. But. How long can this go on?
US$ Index is overbought and is approaching the 30 year downtrend. Short term it is `gapping' in a strong move but this can lead to an overextended market and a trend reversal.
T-Bonds have rallied toward the top of the 33 year uptrend resistance line. I had expected a weak bond market in 2014 but we have had a surge. Short term trends show the same overbought market as the US$ Index - complete with `gaps'. Possible trend reversal action. But how high can the biggest markets in the world go?
Gold Sector - Annual volatility
The gold sector is also very volatile with gold having a 10 year average annual following volatility of about 30% (high less the low, divided by opening price) and gold stocks about 50%.
Gold Gold A$ XAU XGD2015 3% 1% 7% 10%2014 22% 15% 54% 57%2013 31% 21% 56% 71%2012 17% 15% 36% 44%2011 43% 35% 26% 31%2010 35% 27% 52% 58%2009 49% 35% 82% 48%2008 37% 46% 83% 68%2007 38% 25% 53% 54%2006 39% 32% 42% 23%2005 30% 32% 52% 61% 10 Year Ave 34% 28% 54% 52%
It would be nice to see the volatility being positive from here and making January 2015 the low period. The average as a positive gain of 30% for gold and 50% for gold stocks would represent major technical breaks of downtrends.
Gold demand
The importance of the rising middle classes of Asia, especially India and China, on gold demand for jewellery cannot be overstated. The recent monthly demand statistics continue to show growth in imports to India and China at a rate that completely exhausts annual global mine production and recycled scrap supply and then eats into 'inventory'.
Who actually owns this inventory will be important. Central banks are net buyers, China and India are unlikely to be sellers and the ETFs are down to just the true believers. Indeed, rumours are circulating that the central bank in China has also been a very large buyer of gold. Perhaps some Middle East players may feel the pressure of lower oil prices. Government to government sales to China would help.
Recent data on sale of gold coins in the US and Australia shows lower figures but these have always been very small beer compared to India and even much smaller against combined China and India.
A$ gold sector market
The weaker A$ has assisted the A$ gold price to over A$1500/oz so it has broken a downtrend and is now in an uptrend again.
The XGD here in Australia has provided some relief to the 43 month and 81% down bear market by ending with an annual gain in 2014 of 7.8%. But only after making a new 152 month low in November at 1642 (last seen in March 2002) and making 6.5% of 2014's gain in the last few days of December.
It is worth keeping in mind that the A$ gold price was A$1408 at the 8499 peak of the ASX Gold Index in April 2011. It is about 75% lower now with a 7% higher A$ gold price at A$1507.
As noted in the last Dawes Points, the `wedging' in the ASX Gold Index and many key gold stocks was suggesting a change was coming. The move could be strong and `violent' from here. The latest portion of the XGD rally has broken a 20 month downtrend and acceleration could take place now. Hopefully it will be the Wave 3 that takes the XGD to new highs
The table in the December Dawes Points gave some price targets for these gold stocks and the performance since 1 December 2014 has taken us part of the way.
The market leaders were identified as NST, TBR, BDR, TRY, MLX and ABU with OGC, GOR, DRM and SAR as stocks with good market potential.
In addition, important stocks such as NCM, KCN, EVN, RSG, MML and RRL had strong rebound potential from oversold positions where former market leaders may have had stale institutional shareholders bailing out.
1 Dec 5 Jan Change Price Price Index XGD 1701 2221.3 31%Anglo Gold (ASX:AGG) 221 218 -1%Alkane (ASX:ALK) 20 23 15%Alacer (ASX:AQG) 205 277 35%Beadell (ASX:BDR) 19 26 37%Doray (ASX:DRM) 27 47 74%Evolution (ASX:EVN) 43 74 72%Focus (ASX:FML) 1.6 0.8 -50%Kingsgate (ASX:KCN) 62 75 21%Kingrose (ASX:KRM) 25.5 27.5 8%Medusa (ASX:MML) 57 76.5 34%Newcrest (ASX:NCM) 918 1173 28%Norton (ASX:NGF) 14 13.5 -4%Northern Star (ASX:NST) 96 167 74%Oceana Gold (ASX:OGC) 207 230 11%Perseus (ASX:PRU) 24 28 17%Red 5 (ASX:RED) 8.7 9.0 3%Regis (ASX:RRL) 129 198 53%Resolute (ASX:RSG) 23 30 30%Saracen (ASX:SAR) 21 28.5 36%St Barbara (ASX:SBM) 8 13 63%Silver Lake (ASX:SLR) 22.5 23.5 4%Tribune (ASX:TBR) 265 290 9%Troy (ASX:TRY) 46 52.5 14%Gold Road (ASX:GOR) 20.5 28 37%Crater Gold (ASX:CGN) 12.5 12 -4%ABM Mining (ASX:ABU) 22 32 45%Metals Ex (ASX:MLX) 70 82.5 18%Blackham (ASX:BLK) 6.7 7.5 12%
Looking ahead, the gold stocks that interest me for the next six months are set out below with 12 month targets. More will be added later. Stocks are listed alphabetically. All except GOR are producers or very near producers. With most capex now finished, costs under better control and a high A$ gold price, cashflows should soon allow new or increased dividends.
Top ranked are the best companies with the best prospects. Second ranking is for stocks with operating or locational risks. Speculatives are two house stocks with resource upgrade potential but likely to require additional capital over time.
5 Jan Target Gain Price 2015/12Top rank (ASX:EVN) 74 180 143%(ASX:GOR) 28 200 614%(ASX:NCM) 1173 2000 71%(ASX:NST) 167 450 169%(ASX:OGC) 230 600 161%(ASX:RRL) 198 450 127%(ASX:SAR) 28.5 90 216%(ASX:TBR) 290 450 55%Second rank (ASX:ABU) 32 60 88%(ASX:BDR) 26 40 54%(ASX:DRM) 47 110 134%(ASX:KCN) 75 180 140%(ASX:MLX) 82.5 180 118%(ASX:MML) 76.5 250 227%(ASX:RSG) 30 60 100%Speculatives (ASX:BLK) 7.5 25 233%(ASX:CGN) 12 50 317%
The platform is being set, from all the evidence I can gather together, for a strong gold price uptrend to soon take hold. Physical demand is strong, sentiment is very poor, gold prices are rising in many currencies and the gold stocks may yet again be proving to be the key indicators of future direction of gold. The relative performances against the major indices are also strong evidence and here in Australia we actually have some good gains in gold stocks that are showing recoveries and downtrend breaks.
Keep in mind there is only very minor Australian institutional interest in the gold sector. Potential for a robust catch up is strong.
And Australian bank deposits are A$1,661bn as at end November 2014 with A$534bn in term deposits and A$632bn in savings accounts.
Let the markets tell us the true story and if what Dawes Points hears is correct then a strong market should ensue.
Keep in mind also that where gold stocks go, so do other resources. It may take a little more time but resources will probably improve significantly in 2015. Even iron ore and later oil will participate.
Sydney 7 January 2015
Barry Dawes
Contact
Barry Dawes
Paradigm Securities
www.paradigmsecurities.com.au
| ||
|
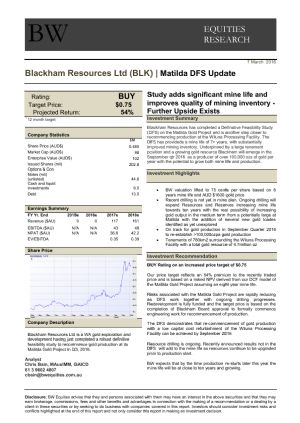
Wiluna Mining Corporation Ltd 


Troy Resources Nl
Tribune Resources Nl
Ten Sixty Four Limited
St Barbara Limited
Silver Lake Resources
Saracen Mineral Holdings Limited
Regis Resources Limited
Red 5 Limited
Perseus Mining Limited
Oceanagold Corporation
Norton Gold Fields Limited
Northern Star Resources Ltd
Newcrest Mining Limited
Metals X Limited
Kingsrose Mining Limited
Kingsgate Consolidated Limited
Gold Road Resources Limited
Focus Minerals Ltd
Evolution Mining Limited
Demetallica Limited
Crater Gold Mining
Beadell Resources Limited
Alkane Resources Limited
Alacer Gold Corp
ABM Resources NL