February 2014 Result - Good Gains Underperform World Markets
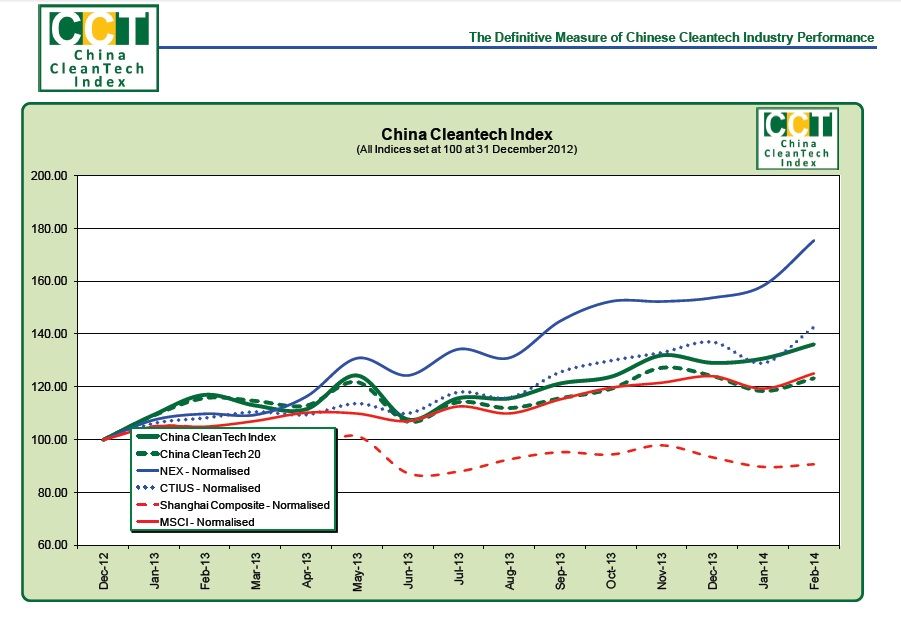
Sydney, Mar 5, 2014 AEST (ABN Newswire) - The China CleanTech Index recorded a 4.1% gain in February 2014 but outperformed only one of its four benchmarks.
The China CleanTech Index rose from 44.93 to 46.78 over the month of February recording a 4.1% gain. This compared to the NEX gain of 10.8%, the CTIUS gain of 10.5%, the Shanghai Composite gain of 1.1% and the MSCI gain of 4.8%.
The China CleanTech 20 also recorded a gain of 4.1% over the month.
The best performing sub-indices for the month were the China Water Index with a 6.8% gain and the China Storage Index with a 6.4% gain. The two weakest sub-indices through February were the China Waste Index which recorded a loss of 12.0% and the China Hydro Index recording a loss of 0.7%.
-----------------------------------------Percentage Change 2011 2012 2013 -----------------------------------------China CleanTech Index -48.0% -16.5% 29.2%China CleanTech 20 -47.4% -15.5% 24.1%NEX -40.2% -5.5% 53.7%CTIUS -18.3% 7.3% 37.0%Shanghai Composite -21.7% 3.2% -6.7%MSCI -7.6% 13.2% 24.1% ----------------------------------------------------------------------------------------------------------------Percentage Change FEB'14 3 Mths 6 Mths 12 Mths 3 Yrs--------------------------------------------------------China CleanTech Index 4.1% 3.2% 17.7% 16.3% -43.5% China CleanTech 20 4.1% -3.1% 10.0% 6.5% -47.2%NEX 10.8% 15.2% 33.9% 59.7% -4.0%CTIUS 10.5% 7.2% 23.0% 31.7% 18.7%Shanghai Composite 1.1% -7.4% -2.0% -13.0% -29.2%MSCI 4.8% 2.9% 13.8% 19.2% 24.0%--------------------------------------------------------
The market capitalisation of the 151 stocks in the China CleanTech Index is CNY 1.05 billion, up a long way from its trough of CNY 604 billion in November 2012.
The month's performance was driven by 15 companies having share price gains of more than 25%. The greatest percentage gains were recorded by China Solar & Clean Energy Solns., Inc. (CSOL), China BAK Battery (CBAK) and Hong Kong Highpower Technology, Inc. (HPJ).
These were offset by losses from other companies with 12 companies having losses of more than 10%. The greatest percentage losses were recorded by SmartHeat Inc (HEAT), Bodisen Biotech, Inc. (BBCZ) and Chiho-Tiande Group Limited (0976.HK).
These best and worst performers are shown in the table below.
February 2014
Best Performers
Share Price Gain > 25%
Shenzhen Sunwin Intelligent Co., Ltd. ( SHE:300044)
China Solar & Clean Energy Solns., Inc. (CSOL:OTCMKTS)
Dongying Photovoltaic Power Co Ltd (CNPV Solar Power SA) (EPA:ALCNP)
Wuhan Linuo Solar Energy Group Co., Ltd. (SHA:600885)
Beijing Easpring Material Technology Co., Ltd. (SHE:300073)
China BAK Battery (NASDAQ:CBAK)
China Sun Group High Tech Co. (CSGH:OTCMKTS)
Hong Kong Highpower Technology, Inc. (NASDAQ:HPJ)
Jiangxi Ganfeng Lithium Co.,Ltd. (SHE:002460)
Sichuan Tianqi Lithium Industries, Inc.
Beijing Enterprises Water Group (HKG:0392)
China Ming Yang Wind Power Group Ltd (NYSE:MY)
Huayi Electric Co., Ltd. (SHA:600290)
Titan Wind Energy (Suzhou) Co Ltd (SHE:002531)
Xiangtan Electric Manufacturing Co.,Ltd. (SHA:600416)
Worst Performers
Share Price Loss > 10%
LED International Holdings Ltd. (LON:LED)
SmartHeat Inc (HEAT:OTCMKTS)
Beijing SJ Environmental Protection and New Material Co. Ltd (SHE:300072)
Bodisen Biotech, Inc. (LON:BODI)
Shanghai Yanhua Smartech Co Ltd (SHE:002178)
Risen Energy Co., Ltd. (SHE:300118)
Suntech Power Holdings (NYSE:STP)
Tianneng Power International Limited (HKG:0819)
Chiho-Tiande Group Limited (HKG:0976)
Nanhai Development Co., Ltd. (SHE:600323)
China Power New Energy Development Co., Ltd (HKG:0735)
CleanTech Innovations Inc. (CTEK:OTCMKTS)
The China Cleantech Index is updated each month and published on the SinoCleantech website at www.sinocleantech.com. It is published internationally in conjunction with Cleantech Investor (www.cleantechinvestor.com) and in China in conjunction with Top Capital (www.topcapital.cn).
Monthly results can be emailed directly to interested parties by signing up to the distribution list at http://www.sinocleantech.com/e/cleantech_index.html
To view the report, please visit:
http://media.abnnewswire.net/media/en/docs/76713-FEB2014-ENG.pdf
About Sino CleanTech
 Sino CleanTech publishes the China CleanTech Index and facilitates Chinese Cleantech investments and provides services to Government agencies across Asia to help stimulate investment in the Cleantech industry. These investments include looking at listed cleantech stocks and direct investment into projects and companies. Sino Cleantech is active in facilitating:
- Investment from Chinese investors into cleantech in both China and internationally; and
- Investment from international investors into the Chinese cleantech market.
Please contact us if you are looking for funding or seeking investments.
![]()
| ||
|
Xiangtan Electric Manufacturing Company Limited 


Titan Wind Energy (suzhou) Co Ltd
Tianneng Power International Limited
Suntech Power Holdings Co., Ltd. 


SmartHeat Inc.
Sino CleanTech
Shenzhen Sunwin Intelligent Co.,Ltd.
Shanghai Yanhua Smartech Group Co Ltd
Risen Energy Co.,Ltd
Nanhai Development Co., Ltd
LED International Holdings Ltd
Jiangxi Ganfeng Lithium Co Ltd
Huayi Electric Co., Ltd.
Hong Kong Highpower Technology, Inc.
Dongying Photovoltaic Power Co Ltd
Cleantech Innovations, Inc.
China Sun Group High Tech Co
China Solar & Clean Energy Solns., Inc.
China Power New Energy Development Co., Ltd
China Ming Yang Wind Power Group Ltd
China BAK Battery
Bodisen Biotech Inc
Beijing SJ Environmental Protection
Beijing Enterprises Holdings Limited
Beijing Easpring Material Techgy Co Ltd
Titan Wind Energy (suzhou) Co Ltd
Tianneng Power International Limited
Suntech Power Holdings Co., Ltd.
SmartHeat Inc.
Sino CleanTech
Shenzhen Sunwin Intelligent Co.,Ltd.
Shanghai Yanhua Smartech Group Co Ltd
Risen Energy Co.,Ltd
Nanhai Development Co., Ltd
LED International Holdings Ltd
Jiangxi Ganfeng Lithium Co Ltd
Huayi Electric Co., Ltd.
Hong Kong Highpower Technology, Inc.
Dongying Photovoltaic Power Co Ltd
Cleantech Innovations, Inc.
China Sun Group High Tech Co
China Solar & Clean Energy Solns., Inc.
China Power New Energy Development Co., Ltd
China Ming Yang Wind Power Group Ltd
China BAK Battery
Bodisen Biotech Inc
Beijing SJ Environmental Protection
Beijing Enterprises Holdings Limited
Beijing Easpring Material Techgy Co Ltd