May 2014 Result Returning to Outperformance
Shenzhen, June 6, 2014 AEST (ABN Newswire) - The China CleanTech Index recorded a 2.9% gain in May 2014 and outperformed all of its four benchmarks.
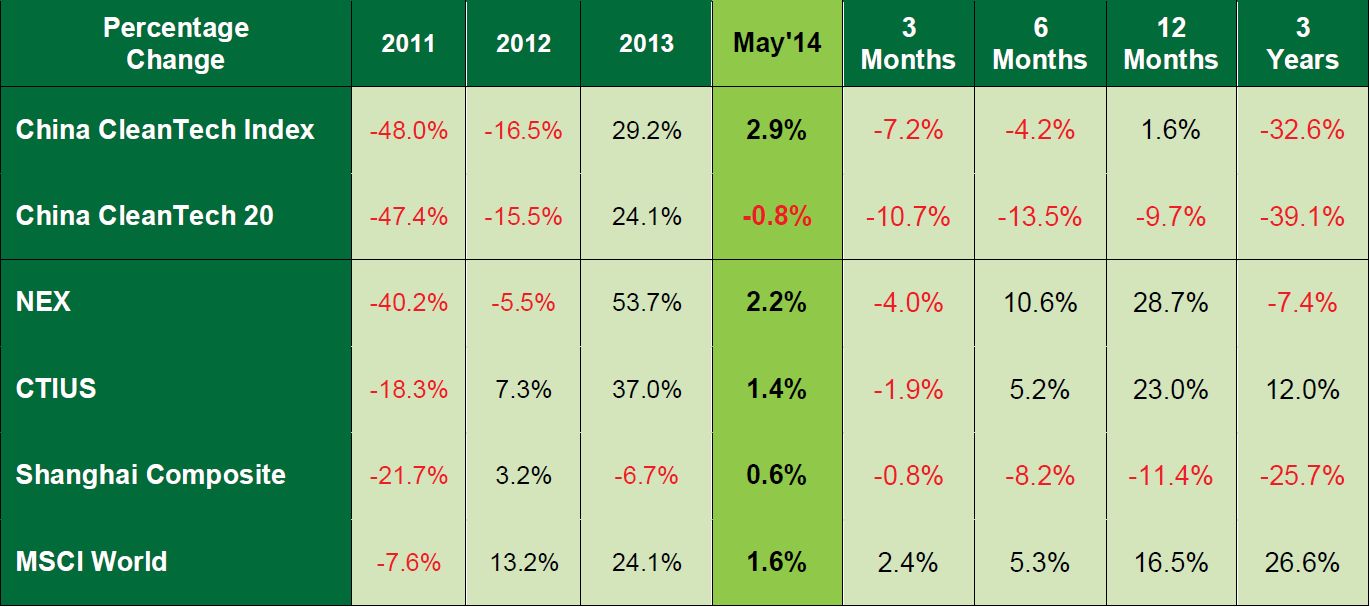
The China CleanTech Index rose from 42.19 to 43.43 over the month of May recording a 2.9% gain. This compared to the NEX gain of 2.2%, the CTIUS gain of 1.4%, the Shanghai Composite gain of 0.6% and the MSCI gain of 1.6%.
The China CleanTech 20 recorded a loss of 0.8% over the month.
The best performing sub-indices for the month were the China Solar Index with a 6.3% gain and the China Water Index with a 5.7% gain. The two weakest sub-indices through May were the China Waste Index which recorded a loss of 6.1% and the China Environment Index recording a loss of 5.6%.
-------------------------------------------------------------------------Percentage 2011 2012 2013 May'14 3 6 12 3Change Mnths Mnths Mnths Yrs-------------------------------------------------------------------------(CCTI) -48.0% -16.5% 29.2% 2.9% -7.2% -4.2% 1.6% -32.6%(CCT20) -47.4% -15.5% 24.1% -0.8% -10.7% -13.5% -9.7% -39.1%(NEX) -40.2% -5.5% 53.7% 2.2% -4.0% 10.6% 28.7% -7.4%(CTIUS) -18.3% 7.3% 37.0% 1.4% -1.9% 5.2% 23.0% 12.0%(SHCOMP) -21.7% 3.2% -6.7% 0.6% -0.8% -8.2% -11.4% -25.7%(MSCI) -7.6% 13.2% 24.1% 1.6% 2.4% 5.3% 16.5% 26.6%--------------------------------------------------------------------------CCTI - China CleanTech Index CCT20 - China CleanTech 20 NEX - Wilder Hill New Energy Global Innovation IndexCTIUS - Cleantech Index SHCOMP - China Shanghai Composite Index MSCI - MSCI World
The market capitalisation of the 165 stocks in the China CleanTech Index is CNY 1.03 trillion, up a long way from its trough of CNY 604 billion in November 2012.
The month's performance was driven by 9 companies having share price gains of more than 20%. The greatest percentage gains were recorded by LED International Holdings Ltd. ( LON:LED), Comtec Solar Systems Group Limited (HKG:0712) and HanKore Environment Tech Group Ltd (SGX:B22).
These were partially offset by losses from other companies with 13 companies having losses of more than 20%. The greatest percentage losses were recorded by RINO International Corporation (RINO:OTCMKTS), Zhejiang Feida Environmental Science Technology (SHA:600526) and China Sun Group High Tech (CSGH:OTCMKTS).
These best and worst performers are shown in the table below.
May 2014
-----------------------------------------------------Best PerformersShare Price Gain > 20%-----------------------------------------------------China Energy Recovery Inc. (CGYV:OTCMKTS) LED International Holdings Ltd. (LON:LED)Tinci Holdings Limited (LON:TNCI)Comtec Solar Systems Group Limited (HKG:0712)Trina Solar Limited (NYSE:TSL)Duoyuan Global Water Inc. (DGWIY:OTCMKTS)HanKore Environment Tech Group Ltd (SGX:B22)China Ming Yang Wind Power Group Ltd (NYSE:MY) Jiangsu Jixin Wind Energy Technology (SHA:601218)-----------------------------------------------------Worst PerformersShare Price Loss > 20%-----------------------------------------------------SmartHeat Inc (HEAT:OTCMKTS)RINO International Corporation (RINO:OTCMKTS)Xiamen Savings Environmental Co., Ltd (SHE:300056)Zhejiang Feida Env.Sci Tech Co Ltd (SHA:600526)Shanghai Yanhua Smartech Group Co Ltd (SHE:002178)Daqo New Energy Corp (NYSE:DQ)Sungrow Power Supply (SHE:300274)China Sun Group High Tech Co (CSGH:OTCMKTS)China Industrial Waste Management (CIWT:OTCMKTS)Guangdong Golden Dragon Development Inc. (SHE:000712)Jiangxi Sanchuan Water Meter Co., LTD (SHE:300066)Shanghai Canature Environmental Prod (SHE:300272)Guizhou Qianyuan Power (SHE:002039)-----------------------------------------------------
The China Cleantech Index is updated each month and published on the SinoCleantech website at:
http://www.sinocleantech.com
It is published internationally in conjunction with Cleantech Investor: http://www.cleantechinvestor.com
and in China in conjunction with Top Capital:
http://www.topcapital.cn
Monthly results can be emailed directly to interested parties by signing up to the distribution list at:
http://www.sinocleantech.com/e/cleantech_index.html
To view the figure, results and the release, please visit:
http://media.abnnewswire.net/media/en/docs/77327-May-2014-EN.pdf
About Sino CleanTech
 Sino CleanTech publishes the China CleanTech Index and facilitates Chinese Cleantech investments and provides services to Government agencies across Asia to help stimulate investment in the Cleantech industry. These investments include looking at listed cleantech stocks and direct investment into projects and companies. Sino Cleantech is active in facilitating:
- Investment from Chinese investors into cleantech in both China and internationally; and
- Investment from international investors into the Chinese cleantech market.
Please contact us if you are looking for funding or seeking investments.
![]()
| ||
|

Zhejiang Feida Environmental Science & Technology Co., Ltd. 


Xiamen Savings Environmental Co., Ltd
Trina Solar Limited
Tinci Holdings Limited
Sungrow Power Supply Co Ltd
SmartHeat Inc.
Sino CleanTech
Shanghai Yanhua Smartech Group Co Ltd
Shanghai Canature Environmental Product Co. Ltd.
RINO International Corporation
LED International Holdings Ltd
Jiangxi Sanchuan Water Meter CO., LTD.
Jiangsu Jixin Wind Energy Technology Co. Ltd.
HanKore Environment Tech Group Ltd
Guizhou Qianyuan Power Co., Ltd.
Guangdong Golden Dragon Development Inc.
Duoyuan Global Water Inc
Daqo New Energy Corp.
Comtec Solar Systems Group Limited
China Sun Group High Tech Co
China Ming Yang Wind Power Group Ltd
China Industrial Waste Management Inc.
China Energy Recovery Inc.