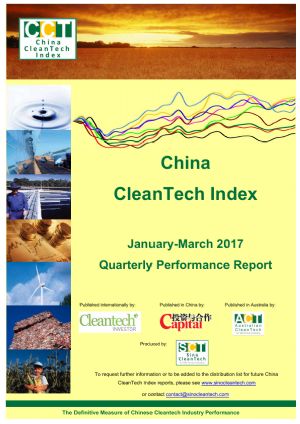
October 2013 - 31% Gain for 12 Months Outperforms China Market
Sydney, Nov 11, 2013 AEST (ABN Newswire) - The China CleanTech Index recorded a 2.1% gain in October 2013 but underperformed against three of its four benchmarks.
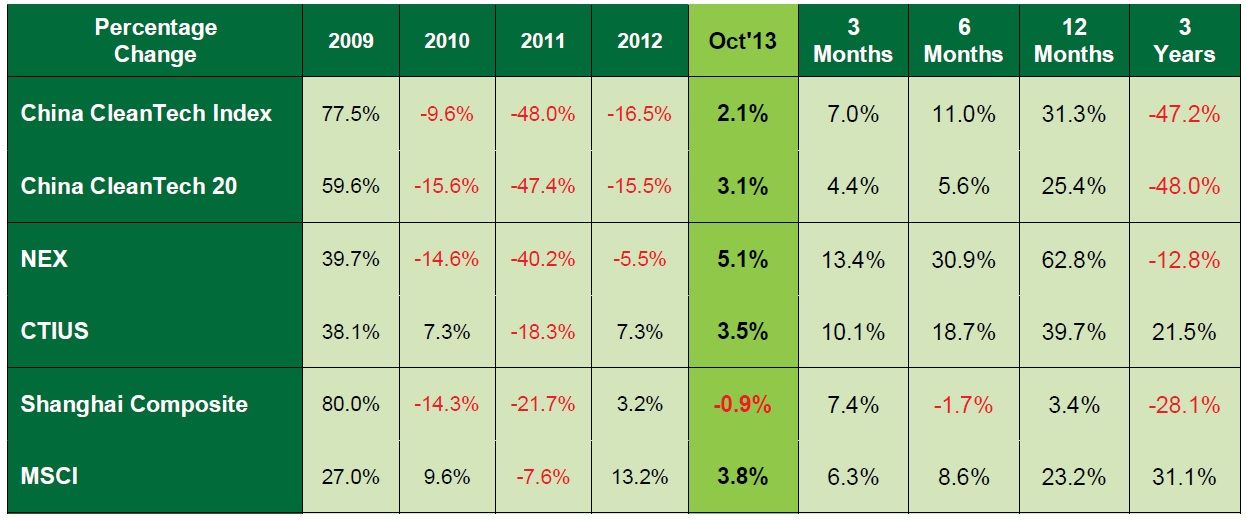
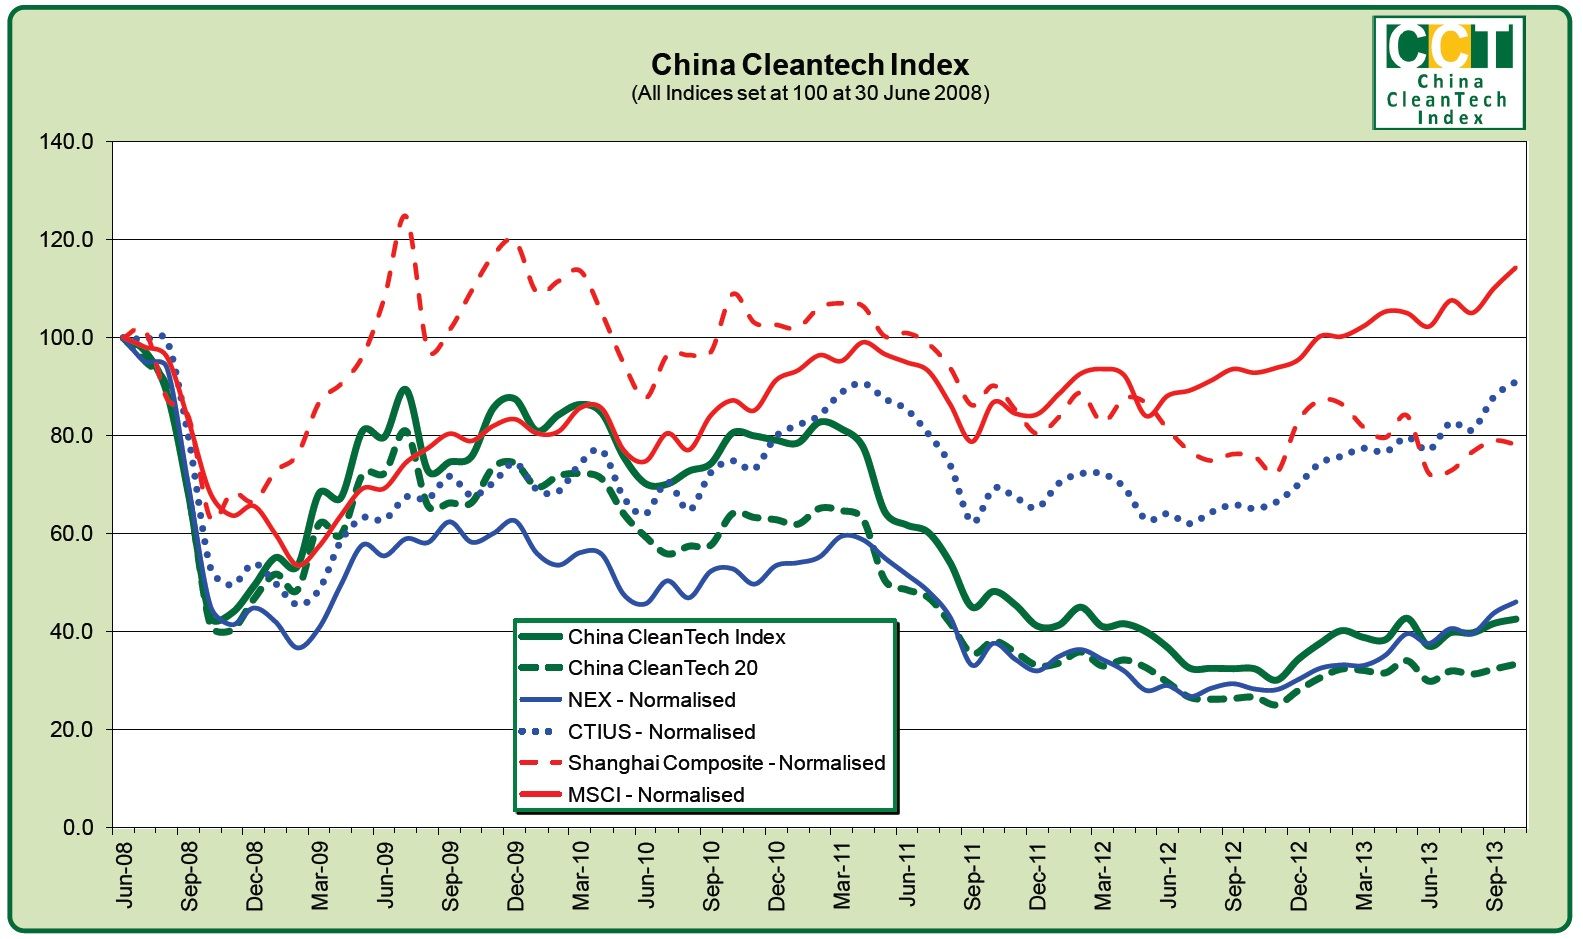
The China CleanTech Index rose from 41.68 to 42.56 over the month of October recording a 2.1% gain. This compared to the NEX gain of 5.1%, the CTIUS gain of 3.5%, the Shanghai Composite loss of 0.9% and the MSCI gain of 3.8%.
The China CleanTech 20 recorded a stronger gain of 3.1% over the month showing that the larger companies are outperforming the smaller companies for the month.
The Index performance for the last 12 months now shows a gain of 31.3%, which is a long way ahead of the 3.4% gain recorded by the Shanghai Composite.
The best performing sub-indices for the month were the China Water Index with a 5.3% gain and the China Environment Index with a 5.0% gain. The two weakest sub-indices through October were the China Storage Index which recorded a loss of 9.5% and the China Efficiency Index recording a loss of 3.5%.
--------------------------------------------------------Percentage Change 2009 2010 2011 2012 --------------------------------------------------------China CleanTech Index 77.5% -9.6% -48.0% -16.5% China CleanTech 20 59.6% -15.6% -47.4% -15.5% NEX 39.7% -14.6% -40.2% -5.5% CTIUS 38.1% 7.3% -18.3% 7.3% Shanghai Composite 80.0% -14.3% -21.7% 3.2% MSCI 27.0% 9.6% -7.6% 13.2% ----------------------------------------------------------------------------------------------------------------Percentage Change OCT'13 3 Mths 6 Mths 12 Mths 3 Yrs--------------------------------------------------------China CleanTech Index 2.1% 7.0% 11.0% 31.3% -47.2%China CleanTech 20 3.1% 4.4% 5.6% 25.4% -48.0%NEX 5.1% 13.4% 30.9% 62.8% -12.8%CTIUS 3.5% 10.1% 18.7% 39.7% 21.5%Shanghai Composite -0.9% 7.4% -1.7% 3.4% -28.1%MSCI 3.8% 6.3% 8.6% 23.2% 31.1%--------------------------------------------------------
The market capitalisation of the 150 stocks in the China CleanTech Index is CNY 943 billion, recording a new high for the sector and up a long way from its trough of CNY 604 billion in November 2012.
The month's performance was driven by 16 companies having share price gains of more than 20%. The greatest percentage gains were recorded by China Energy Recovery Inc (CGYV), C&G Environmental Protection Holdings Ltd (D79.SI) and Hong Kong Highpower Technology, Inc.(HPJ)
These were offset by losses from other companies with 6 companies having losses of more than 20%. The greatest percentage losses were recorded by Hanwei Energy Services (HNWEF.PK), Bodisen Biotech, Inc. (BBCZ) and Duoyuan Global Water (DGWIY).
These best and worst performers are shown in the table below.
October 2013
Best Performers
Share Price Gain > 20%
-----------------------------------------------China Energy Recovery Inc ( CGYV:OTCMKTS)SmartHeat Inc (HEAT:OTCMKTS)Xiamen Savings Environmental Co., Ltd. (SHE:300056)Canadian Solar Inc (NASDAQ:CSIQ)China Solar & Clean Energy Solns., Inc. (CSOL:OTCMKTS)China Sunergy (NASDAQ:CSUN)E-Ton Solar Tech (TPE:3452)Risen Energy Co., Ltd. (SHE:300118)Shunfeng Photovoltaic International (HKG:1165)Hong Kong Highpower Technology, Inc. (NASDAQ:HPJ)C&G Environmental Protection Holdings Ltd (SGX:D79)China Recycling Energy Corp. (NASDAQ:CREG)Jiangsu Welle Environmetnal Co., Ltd. (SHE:300190)Novarise Renewable Resources Ltd (ASX:NOE)Nanhai Development Co., Ltd. (SHA:600323)China Energine International (Hldgs) Ltd (HKG:1185)-----------------------------------------------
Worst Performers
Share Price Loss > 20%
-----------------------------------------------Hanwei Energy Services (TSE:HE)Bodisen Biotech, Inc. (LON:BODI)LDK Solar (NYSE:LDK)Coslight Technology International Group (HKG:1043)Sunwoda Electronics Co (SHE:300207)Duoyuan Global Water (DGWIY:OTCMKTS)-----------------------------------------------
The China Cleantech Index is updated each month and published on the SinoCleantech website at www.sinocleantech.com. It is published internationally in conjunction with Cleantech Investor (www.cleantechinvestor.com) and in China in conjunction with Top Capital (www.topcapital.cn).
Monthly results can be emailed directly to interested parties by signing up to the distribution list at:
http://www.sinocleantech.com/e/cleantech_index.html
About Sino CleanTech
 Sino CleanTech publishes the China CleanTech Index and facilitates Chinese Cleantech investments and provides services to Government agencies across Asia to help stimulate investment in the Cleantech industry. These investments include looking at listed cleantech stocks and direct investment into projects and companies. Sino Cleantech is active in facilitating:
- Investment from Chinese investors into cleantech in both China and internationally; and
- Investment from international investors into the Chinese cleantech market.
Please contact us if you are looking for funding or seeking investments.
![]()
| ||
|
Xiamen Savings Environmental Co., Ltd 


Sunwoda Electronics Co. Ltd.
SmartHeat Inc.
Sino CleanTech
Shunfeng Photovoltaic International Ltd
Risen Energy Co.,Ltd
Novarise Renewable Resources Intl Ltd
LDK Solar Co., Ltd 

Jiangsu Welle Environmental Co Ltd
Hong Kong Highpower Technology, Inc.
Hanwei Energy Services
E-Ton Solar Tech
Duoyuan Global Water Inc
Coslight Technology International Group
China Sunergy Co Ltd
China Solar & Clean Energy Solns., Inc.
China Recycling Energy Corp.
China Energy Recovery Inc.
China Energine International Hldgs Ltd
Canadian Solar Inc.
C and G Environmental Protection Hldgs Ltd
Bodisen Biotech Inc
Sunwoda Electronics Co. Ltd.
SmartHeat Inc.
Sino CleanTech
Shunfeng Photovoltaic International Ltd
Risen Energy Co.,Ltd
Novarise Renewable Resources Intl Ltd
LDK Solar Co., Ltd
Jiangsu Welle Environmental Co Ltd
Hong Kong Highpower Technology, Inc.
Hanwei Energy Services
E-Ton Solar Tech
Duoyuan Global Water Inc
Coslight Technology International Group
China Sunergy Co Ltd
China Solar & Clean Energy Solns., Inc.
China Recycling Energy Corp.
China Energy Recovery Inc.
China Energine International Hldgs Ltd
Canadian Solar Inc.
C and G Environmental Protection Hldgs Ltd
Bodisen Biotech Inc